Two full seasons of the Buildcorp National Rugby Championship are very nearly behind us, and the general consensus from everyone I’ve spoken to during Season 2 - coaches, players, referees, commentators, supporters, everyone - is that we’ve seen an even better tournament in 2015.
Certainly, it feels like wins have been harder to come by, and that at on any given day, any team was capable of beating the mob on the other side of halfway.
Heading into the semi-finals last season, we had one dominant, runway team, then another couple back from them, and then several more teams fighting for the last playoffs spot. The finals standings after the completion of the nine regular season rounds in 2014 were:
Melbourne Rising 40, NSW Country Eagles 27, Brisbane City 26, Perth Spirit 17. Greater Sydney Rams took fifth spot with 16 competition points.
That represents a spread of 23 competition points from 1st to 4th place, though it obviously didn’t matter to Perth, who promptly beat the previously unbeaten Melbourne in the semi-final and turned the competition on its head!
In 2015, the spread is only 18 points: Brisbane City 38, University of Canberra 35, Sydney Stars 20, Melbourne 20. NSW Country finished 5th on 19 points.
So the immediate difference between the two seasons is that with two dominant teams rather than just one, it’s meant that the trailing teams had to win more games to be in finals contention.
Sydney, Melbourne, and NSW Country all finished with better records in 2015 than did 4th-placed Perth in 2014. In fact, Perth in 2015 finished in 6th with only one point behind their 2014 tally, which saw them sneak into 4th.
Tries
I wrote at different stages during the season that the overwhelming perception was that defences in 2015 were much better aligned, were fitter and therefore defending for longer, and generally speaking, were just harder to crack than the season before.
Yet in 2015, there were 21 more tries scored by the end of the regular season than in 2014. Last season, we saw 328 tries (including six penalty tries) scored by 158 different tryscorers. In 2015, the number is 348 tries (including five penalty tries) from 150 different players.
In 2014, those 328 tries came at an average of 9.1 tries per game, across the nine rounds. In 2015, the number has gone up, to 9.7 tries per game.
Ball in Play (BIP)
The most common explanation for why more tries were being scored in the face of what was perceived to be better defence across the competition was that the bright yellow Gilbert NRC ball was in play more than we’ve become used to.
The Ball In Play average for the season came in at 34:49 (mm:ss). If we break the season into two halves, Rounds 1 to 5, and Rounds 6 to 9, the BIP time did decrease by around 17 seconds per game on average in the second half of the season, as defences starting tightening up heading toward the finals.
Using the same season split, the tries per game average also dropped from 10.1 per game in the first five rounds to 9.1 per game in the last four rounds.
Of that 34:49 BIP average across the 36 games, 16 games featured more than 35 minutes of action, while nine of those saw the ball in play more than 37 minutes. The high point was the first game of the 2015 season, where Brisbane City and Perth played for a scarcely believable 40 minutes 21 seconds. Fortunately, from a player endangerment perspective, that trend didn’t last.
Goalkicking
Has remained similar to 2014, in that a competition average of 70-71% success continued. Obviously, there were more conversions attempted in 2015, but where nine two-point penalty goals were kicked from 13 attempts last season, in 2015 it was just two from three attempts. No NRC Captain pointed to the posts from Round 5 onwards this season.
The regular kickers have certainly improved their accuracy though, and this is a promising sign for what has been something of an issue in Australian rugby over the last 18 months.
In 2014, the top success rate among regular goalkickers was in the high seventies, with North Harbour’s Hamish Angus on top at 80% for the season (Quade Cooper kicked 13/15, or 87% in his three games for Brisbane City).
In 2015, Buildcorp NRC Player of the Year Jono Lance (NSWC) and Ian Prior (PER) led the way on 83%, with Angus and Sam Greene (QldC) both topping 80%, and the season’s leading pointscorer, Jake McIntyre (BRI) missing just ten of his 48 shots at goal, for a 79% success rate.
Penalties and Yellow Cards
In 2014, the breakdown was an average of 24 penalties per game, 1.9 free kicks per game, and 1.5 yellow cards per game.
In 2015 the breakdown is:
• 21.9 penalties per game (High of 31, Low of 13);
• 1.2 free kicks per game, and
• 1.5 yellow cards per game.
The good sign here is that though penalties and free kicks have decreased (also a reason why BIP time increased in 2015), referees remain unafraid to hand out yellow cards. In total, 53 yellows and four red cards were handed out over the 36 games.
With penalty goals reduced to two points under the Buildcorp NRC Law Variations, it’s crucial that referees remain on top of cynical infringements, particularly. Happily, this is the case, with referees happy to blow the penalty, dish out the card, and teams winning the penalty invariably kicking for the corner to set up the lineout drive.
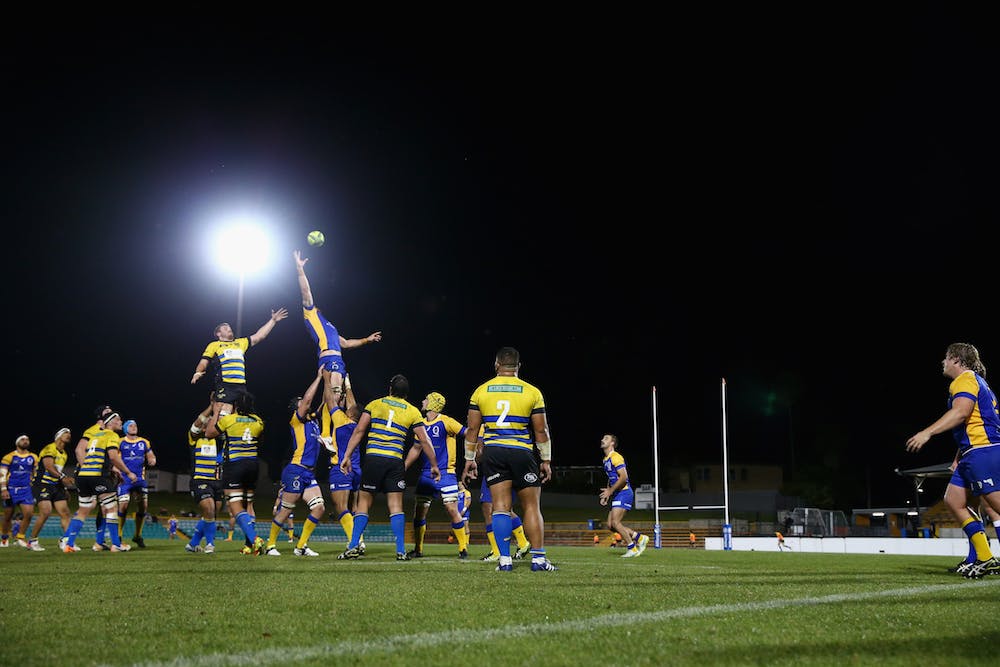
Lineouts and Scrums
In 2014, we saw an average of 24 scrums per game, and 30.4 lineouts per game, as callers scrambled throughout the season to come up with new calls or indeed, new lineout plays, with full repertoires often being exhausted well before fulltime.
In 2015, we’ve seen an average of 19.1 scrums per game, and 27.7 lineouts (not including quick throw-ins).
We saw the ball coming out of scrums 67% of the time per game, on average, and with an average 5.4 scrum resets per game. There were wild fluctuations in the Scrum Ball Out figure, ranging from a low of 40% (but only three games with a SBO% of less than half the time) to a high of 88%, and four other games scoring in the eighties.
The scrum remained a key component of teams establishing set piece dominance, and as we’ve seen with the Wallabies over at the Rugby World Cup, the dominant scrum almost always won NRC games in 2015. This is another healthy sign for Australian rugby.